POF’s self-serve platform implements a CPM-based bidding system that does not take into account incremental bids, meaning what you bid is what you pay. If you have even run a few campaigns on POF, you must have wondered what a higher bid actually buys you.
We know that a higher bid is supposed to give you more volume and higher quality traffic (i.e. lower session depth traffic), but what is the magnitude of the effects? In this case study, we tackle the volume question. We’ll save quality for a later date.
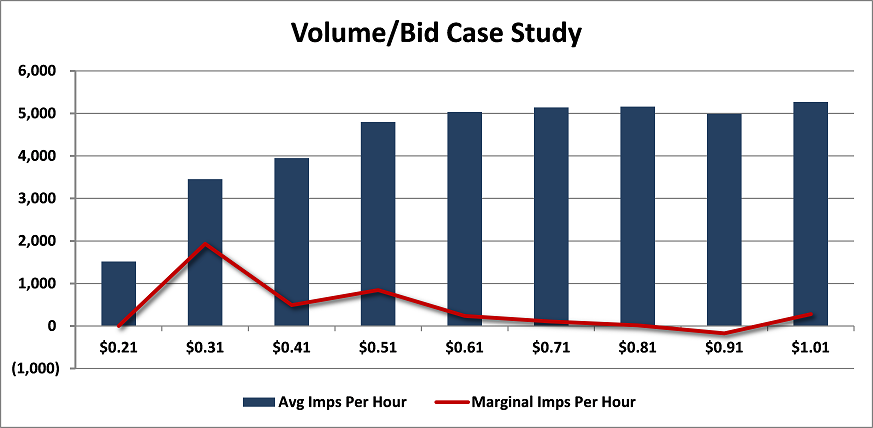
The results were very interesting: there is a price point where major volume drop-off occurs and a high price point where further increases could be achieved again.
Here is the data, followed by our interpretation:


How the Data was Collected
The data was collected using the POF Traffic Volume Monitor over an 8 hour period from 12pm CST to 8pm CST on a Saturday. We used 4 different campaigns. These campaigns weren’t broad campaigns but they aren’t targeting micro-niches either. They all had frequency caps of 3 per visit and distributed traffic ASAP.
Bids were adjusted between $0.21 and $1.01 by increments of $0.10 every 15 minutes. When the campaigns reached $1.01, we would lower the bid down to $0.21 for the next 15 minute interval. Since we were testing bid prices over 8 hours, performing the test in this manner controlled somewhat for the variation of traffic over time of day.
Since we didn’t perform the test for days and days, there was some volatility over a smaller sample size as manifested through the non-smooth line, but all we’re looking for is a general trend.
How to Read the Data
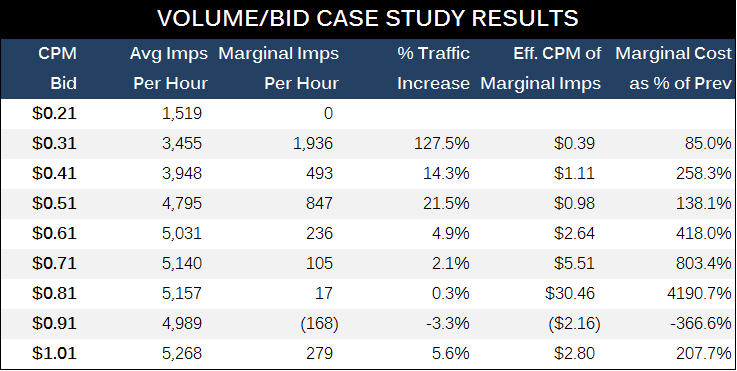
Looking at the table, the “CPM Bid” of course indicates the CPM price points we tested.
“Avg Ims Per Hour” is the average number of impressions gained per hour at those bid levels.
“Marginal Imps Per Hour” is where the data starts getting interesting. It refers to the incremental amount of traffic gained from increasing the bid by $0.10. For instance, when bid was increased from $0.21 to $0.31, our data showed that the campaigns gained 1,936 impressions on average.
“% Traffic Increase” is the magnitude of marginal traffic received. For instance, when bid was increased from $0.21 to $0.31, traffic increased 127.5%, or more than doubled.
“Eff. CPM of Marginal Imps” refers to the effective CPM of the additional impressions received by raising the bid. For instance, when bid was increased from $0.21 to $0.31, the campaigns gained 1,936 impressions per hour on average. Those 1,936 additional impressions effectively cost us $0.39 per 1,000 impressions, since we could have gotten the first 1,519 impressions by only spending $0.21 per 1,000 impressions.
“Marginal Cost as % of Prev” refers to the increase in cost for the additional traffic gained by bidding $0.10 higher. For instance, when bid was increased from $0.21 to $0.31, the 1,936 additional impressions we received cost us 85% more than the first 1,519 impressions.
What does the data tell us?
We can see that there is a huge boost in traffic going from $0.21 to $0.31. We still see pretty good increases in volume up to $0.51. We still get small gains from $0.61 to $0.71, but we really don’t see any incremental traffic as we bid $0.71 and higher. That is, until we get to over $1. At $1.01 we see another increase in volume. We did not test any bids higher, but my hypothesis is that there is a clear divide between the average performing and broad-targeted campaigns, which bid in the $0.50’s and lower, and the niche-targeted, higher CTR campaigns, which bid over $0.70. Once you’re bidding over $1, you start to leave the majority of the pack behind, and the campaigns start to see more volume, beating out a majority of the campaigns. From this data, it looks like you shouldn’t be bidding higher than the $0.50’s unless you can bid over $1 as you start to see very little gain in traffic (only 4.9% more traffic from $0.51 to $0.61).
Let’s also take a look at how much the additional traffic cost you when you increase bids. As you can see, the cost goes up exponentially. While additional impressions received by increasing bid from $0.21 to $0.31 cost only $0.39 effective CPM, by $0.61, the extra traffic you gain from increasing from $0.51 cost us $2.64 effective CPM. By $0.81, it got as high as $30.46 (yes, that’s effectively $30.46 for 1,000 impressions), which clearly indicates to us that increasing from $0.71 to $0.81 just isn’t worth it for our campaigns.
Based on this data, the general takeaway seems to be to stay in the $0.21 to $0.50’s range unless your campaign truly justifies a high bid greater than $0.91. Remember, we have not taken into account the quality of traffic and its effect on campaign performance, so when you make decisions for specific campaigns, you need to analyze the overall and marginal profitability of those campaigns. What we’ve uncovered here, however, can be used as a general rule.
We hope you found this experiment interesting and helpful. If you’d like to download a copy of the data from this case study, please do so below. It will give you a good idea as to how to go about doing similar analyses for your own campaigns, if you so choose.
[wpdm_file id=7]
Tom… awesome post. Very interesting data… I’m going to look at my campaigns and see whats up and where I’m bidding…
awesome post man, seriously. I’ve been bidding at .71 with some EXTREMELY niche targeting and making some huge ROI, but volume is disgustingly low… still trying to figure out how to take those bad boys and make them rock more.
Thanks Austin. Usually it’s difficult to scale up the micro-targeted, huge ROI campaigns. They are very good hands off, easy income though.
Sweet post Tom!
[…] http://ipyxel.com/pof-case-study-the-cpmbid-vs-volume-relationship/ […]
Fantastic post! Great information to know. I usually try to stay between $0.20-0.50 and it looks like my guesswork has been correct 🙂
Nice to see the numbers. But even at .15 ctr – you’re only getting about 10 clicks per hour. POF is weak for click volume.
Sounds like you are speaking from no experience on POF. If you know how I operate or read my guide, I make narrow targeted campaigns. These are 4 out of hundreds of campaigns that I run. No POF is not Facebook, so you’re not going to get that kind of volume, but POF maintains an average CTR of about 0.15%, which is a lot higher than Facebook’s.
did you notice or track any CTR changes with different bid amounts? i.e. was CTR better the higher you bid?
Very cool case study. What ad size were you using? I can definitely see the value in your free tool. IMO it would be cool to see a similar case study that compares the effect of bid price on volume for 2 (or more) campaigns that are targeted very differently. For some very targeted campaigns I’ve had to bid over $2 CPM before I got a big jump in the number of impressions.
What if you try bidding way higher? Like double or triple or quadruple (or more) your bid? If you have a huge ROI maybe you can afford it… and you might be surprised at the increase in traffic IMO. If you DO experiment with some dramatic bid increases pls post back on the effect, if you’re willing to share 🙂
Yeah we didn’t test super high bids obviously. Would be interested in this as well.
No, as I mentioned we didn’t track impact of quality as we changed bids. That’s something that experiences a LOT more variability and data over 15 minute intervals over a day wouldn’t be that dependable in my opinion. I will try to do a case study on this in the future with data over weeks. Already have been collecting some data on it.
Thanks Justin. These were small ads. Yeah, I agree that this might not apply for very different campaigns like really broad ones, really niche ones, or maybe really high login counts. I decided to use 4 campaigns (they were targeting different countries, different age groups, and had different angles) just to diversify the data a little bit. I was pretty cheap also since I didn’t want to waste a lot of money testing either 😛
[…] affiliate marketing platforms out there, and Tom Fang has done some fascinating work studying ad volume against CPM bid – “We can see that there is a huge boost in traffic going from $0.21 to $0.31. We still […]
Not so fast. Facebook ctr is better than that when you know what you’re doing. Plus, bids can get as low as .19 for some very hot campaigns. Never seen that on POF.
I said average CTR. As in across all impressions. No one’s making an argument which traffic source is better. It’s just clear you have no experience with POF based on your initial statement.
No, again. My average CTR on Facebook is above .15 and I get a lot more Clicks, my friend. I realize you’re trying to pump your ebook, but the facts remain – facebook is a more reliable source of traffic… especially if you’re not doing jackass promotions and you stay above board.
I was saying across the entire traffic source. Not talking about you whoever you are lol, but that was before you proved you were such a Facebook BSD! Sorry, I was wrong. You can only get 10 clicks/hour on POF. Everyone stay away and go promote Insane Weightloss on FB. I hope you’re not Concerned anymore.
[…] thanks for the great response to the volume case study last week. We’ve been working on a bid vs. quality case study that I will hopefully be able […]
[…] couple weeks ago, we did a case study on how bidding affected volume. The case study showed that after some point, increasing the bid had very little effect in […]
[…] feel free to check out our other posts on How Create a Landing Page, Targeting/Delivery Methods, Bidding Tips, or comment […]
[…] is assuming that you have no frequency cap nor daily budget set on your campaign. Check out our Bid vs. Volume Case Study for some empirical data on […]
why delete my post? this demonstration is inaccurate because of dayparting times…sorry buddy. traffic fluctuates in an 8 hr period bro….
dont get butthurt and delete my post because you didnt take dayparting into account. scrub.