A couple weeks ago, we did a case study on how bidding affected volume. The case study showed that after some point, increasing the bid had very little effect in increasing volume. In today’s case study, we tackle the other question: does changing bids affect traffic quality? Higher quality can be defined in terms of higher CTR’s, higher CVR’s, and higher EPC’s, but at the end of the day, what we really care about is: did it increase the bottom line? We will attempt to answer that today, and I think you’ll find the results incredibly interesting.
It’s important to note that since these case studies are based upon our own campaign data (and we’re not using all campaigns), there will always be some sampling error, not to mention data variance from performance volatility. What I want to demonstrate are only general trends across multiple campaigns. Individual campaigns behave vastly different from one another, so it’s important to treat each campaign as such and not just apply the trends we find here to all your campaigns across the board.
How the Data was Collected
The data was collected using a tool we built internally over the last 5 months (starting on December 11, 2011). We keep track of individual campaign performance every single day and log the CPM bid the campaigns runs at that day. For our stabilized campaigns (upon which this case study is based), we never change the bid during the day. We are disciplined enough to only change the bid once in the morning if we are changing bids at all, and therefore, we are able to assign that day’s performance data to that specific CPM bid. We’ve been tracking this data long before I thought of this case study simply so we can target optimal CPM bid points for our campaigns.
I selected data from 25 of our campaigns to use as the data for this case study. These campaigns are diverse across multiple countries, niches, and angles, but they are all under 100 login count. I’ve also filtered the campaigns for insignificant data such as not enough impressions, clicks, or conversions. The minimum amount of impressions for a narrowly targeted campaign had to be 5,000 per day in order to make this case study. We were able to extract a little over 200 total bid changes across these campaigns over the 5 months, so that’s how many data points we have. About 120 were bid decreases, and 80 were bid increases.
Using this data, we looked at all the times that we changed bids during the last 5 months for these 25 campaigns. We looked at the effect when we decreased the bid versus when we increased the bid, the effect of the magnitude of bid change, and their impact on campaign CTR, CPC, CVR, EPC, and PPM, or profit per thousand impressions, which is translatable to ROI.
Data Analysis
Since the data can be confusing to interpret, I’m going to explain everything with the help of graphs. We’re going to evaluate the effect of change on each of the metrics mentioned above based on the magnitude of CPM bid change. To keep the graphs easily readable, I’ve put outlier data points out of view. In addition, it’s important to note that these data points are not weighted, meaning some campaigns that got fewer impressions received the same treatment as campaigns that got more impressions (i.e. they each got one data point).
Unlike the bid vs. volume case study, I’ve made a decision to not release the raw campaign data for this case study due to the fact that it may reveal too much information regarding where these campaigns are bidding and their respective returns. If you have any data-specific questions, I would be more than happy to clarify.
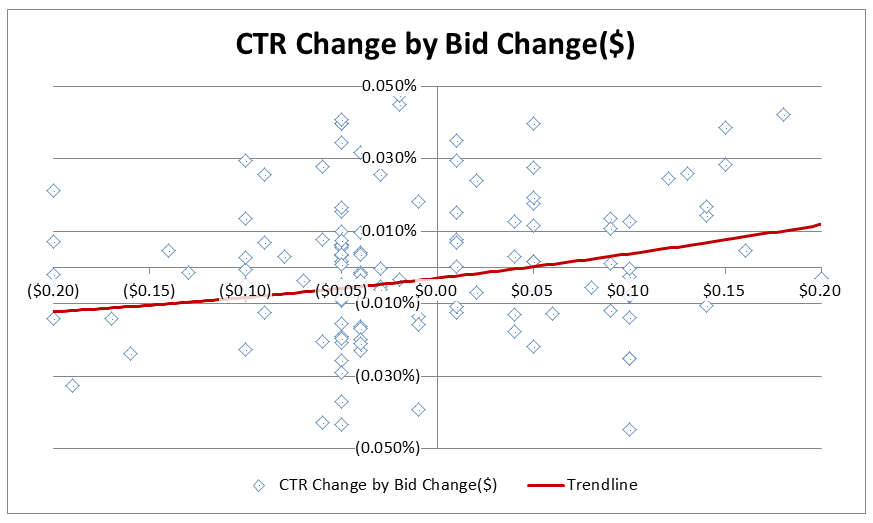
How to read the graph. The x-axis indicates the magnitude of bid change. This is ubiquitous on all subsequent graphs as well. ($0.05) would mean that we lowered the bid by 5 cents, and $0.10 would mean we raised the bid by 10 cents. As you can see there are a lot of data points that line up exactly at the 5 and 10 cent marks. This accurately illustrates that we often change bids by 5 or 10 cent increments or decrements. The y-axis indicates the CTR change in points. For example, if a data point is at the 0.010% level, then that means that specific bid adjustment effectuated a 0.010% increase in CTR. So, after that bid change the campaign’s CTR may have increased from 0.100% to 0.110%.
What this means. As you’ll find in all subsequent graphs, the data points are all over the place, indicating relatively high variance, which fortifies the point I made earlier in that one individual campaign can react to bid changes radically differently from another. If we take a look at the bottom right quadrant, however, we can see clearly that there are very few data points there, which indicates that generally speaking, increasing your bid increases campaign CTR. The trend line shows us a positive trend that seems to indicate increasing your bid by $0.17 will increase your CTR by 0.010%. This may not seem like much, but I know from our data that for certain campaigns it increased CTR substantially. Remember again that the data has high variance and are just general trends, and outliers are outside the range of the graph you see here.
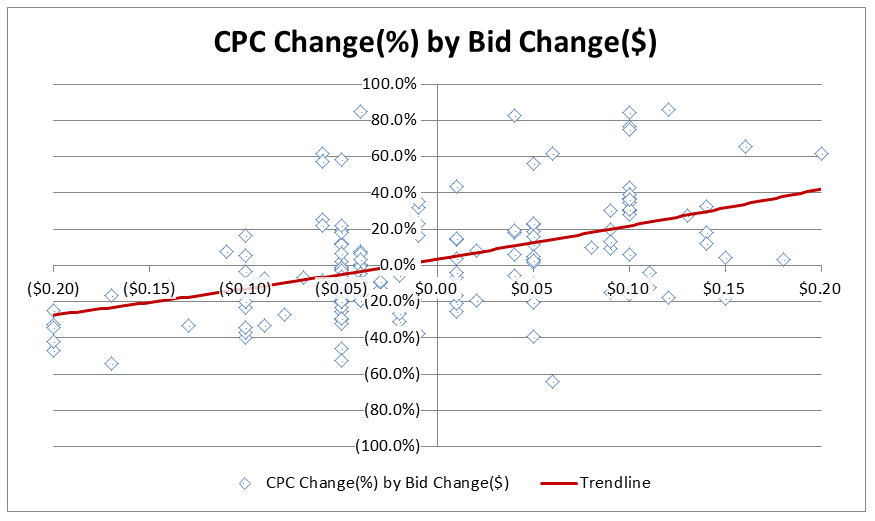
How to read the graph. The y-axis indicates the % change in CPC from bid adjustments. For example, if a data point is at the 20% level, then that means that specific bid adjustment effectuated a 20% increase in CPC. So, that bid adjustment may have increased the CPC for that campaign from $1.00 to $1.20.
What this means. There is a clear trend between bids and CPC. Not surprisingly, increasing your bid increases your CPC. The CTR increase you gain from increasing your bid does not outpace the price you have to pay for it. Based on our data, in general, a $0.10 increase in bid effectuated a 20% increase in CPC. From the perspective of getting clicks only, you should only increase your bid if you want more click volume, but know that the marginal clicks come at a higher price.
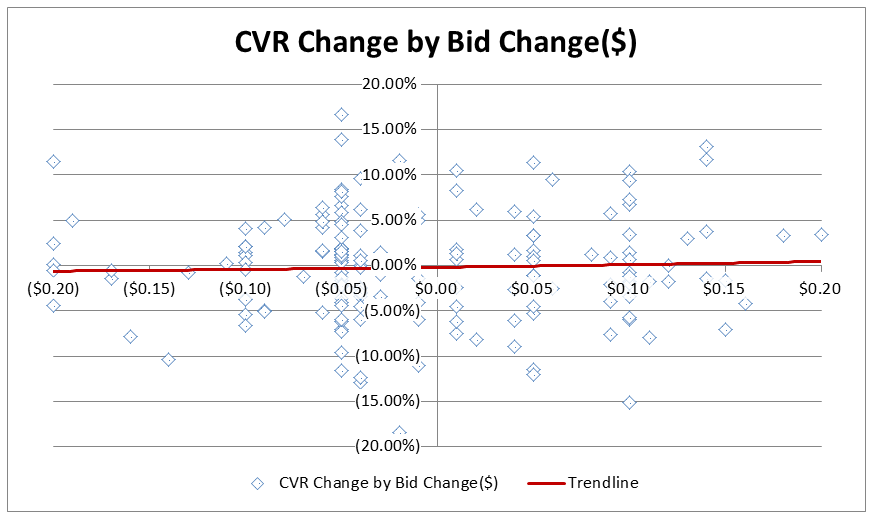
How to read the graph. The y-axis indicates the CVR change in points. For example, if a data point is at the 10% level, then that means that specific bid adjustment effectuated a 10% increase in CVR. So, that bid adjustment may have increased the CVR for that campaign from 10% to 20%. Keep in mind that CVR could have moved for a variety of reasons. We can’t perform a perfectly controlled experiment, so we can only rely on the data we have.
What this means. This data set is very interesting. Of course, the data is again very scattered. Certain campaigns reacted positively to bid increases and some negatively. As a general trend, however, bid changes had virtually no effect on CVR. Based on the trend line, you can see a tiny positive trend as you increase bids, but in my opinion, it’s negligible. There’s been discussion in the past that higher bids gets you traffic that converts better. As a general trend, based on this data, not really.
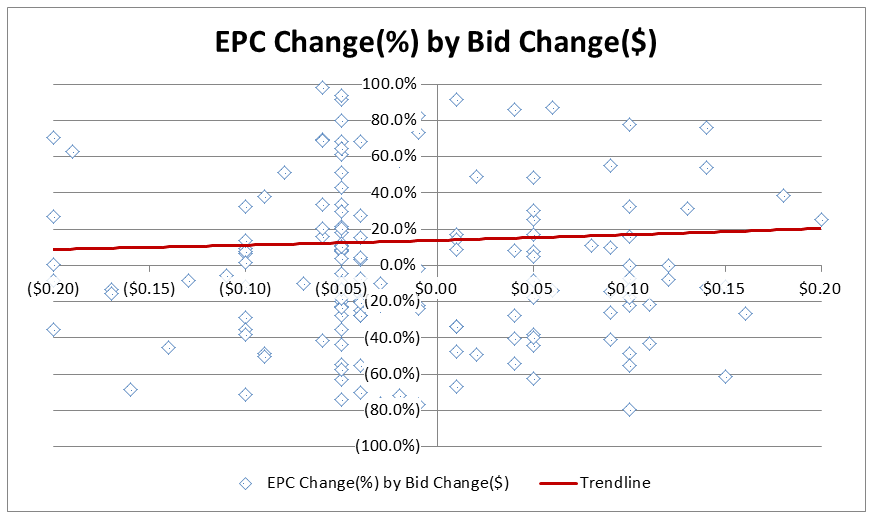
How to read the graph. The y-axis indicates the % change in EPC from bid adjustments. For example, if a data point is at the 40% level, then that means that specific bid adjustment effectuated a 40% increase in EPC. So, that bid adjustment may have increased the EPC for that campaign from $1.00 to $1.40.
What this means. The trend indicated here is expected based on what we just found out regarding CVR. There is a slightly positive trend as you increase your bid. Based on this data, an increase of $0.20 in bid effectuated a 20% increase in EPC on average. The general positive effect certainly isn’t mind-blowing. You may have noticed that the trend line sits above the x-axis at all times, meaning that in general, we increased our EPC whenever we adjusted bids. This may have been caused by variance, but it might not have been an accident. Whenever we changed bids, it was probably because the current bid did not perform well for the campaign. We would change it to a bid that we thought would perform better. Therefore, there may have been some behavioral bias in producing the data, but the general trend should not be affected by this.
In addition, you can tell that across these campaigns, the rise in CPC outpaced the increase in EPC as bids were raised. This goes to show that, if you had no niche-specific or angle-specific knowledge, you should probably only increase bids if you are running enough positive margin that increasing volume may decrease that margin but will get you higher profitability.
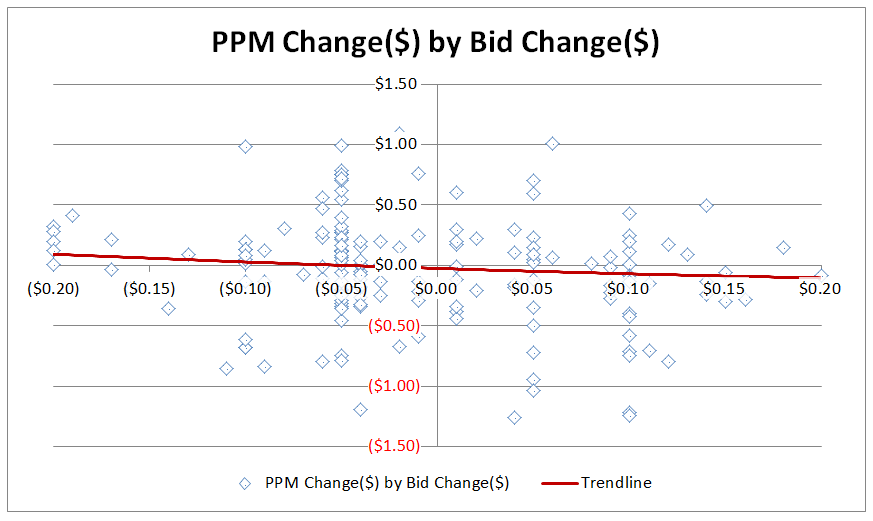
How to read the graph. PPM is “profit per mile”, which is the profit received from each 1,000 impressions. The y-axis indicates the change in PPM from bid adjustments. For example, if a data point is at the $1.00 level, then that means that specific bid adjustment effectuated a $1.00 increase in PPM. So, that bid adjustment may have increased the PPM for that campaign from $1.00 to $2.00, doubling the profitability for every 1,000 impressions. This is a metric that is synonymous with ROI and measures profitability while controlling for volume.
What this means. Across these campaigns, changing bids really didn’t have too much of an impact on PPM. There’s even a slight negative trend as we increased bids. As a general trend, the higher bid equals higher quality is somewhat true: higher CTR’s and slightly higher EPC’s. Is it, however, worth the price? Based on this PPM graph, half the time it is, half the time it isn’t. Lower PPM, does not mean, however, lower overall profit! PPM takes out the effect of volume. It seems the general trend based on two case studies, then, is if a campaign is profitable and bidding low ($0.50’s or below based on volume vs bid case study) and has a relatively high ROI, it may be worth testing higher bids to see if you gain additional volume and see if that volume is worth the incremental cost. For the same campaign, if there isn’t much more volume above the bid it’s currently at, then there is less of a reason to bid higher since it doesn’t seem like the increase in quality is worth the cost.
Take-Aways
As a summary, our data indicates that increasing bids generally increases CTR, but not by a huge amount as an aggregate. We did experience high variability in all data collected, which means certain campaigns did increase substantially. CPC increases in tandem as CTR and bids increase. There isn’t as much of an effect on as bids increased. There is a slight positive trend with EPC’s, but the magnitude seems to be negligible. The increases in EPC was outpaced by the increases in CPC, and even in combination with the increases in CTR, the overall PPM was generally unaffected to slightly negative as bids increased.
The biggest take-away has to be that each campaign is so different that you really have to test each one. While general trends shown here may not point toward raising your bids across the board, you can see that the results were highly varied and campaign performance increased substantially half of the time. Over time, you may start to see the trends for specific niches and types of campaigns, at which point you will just have fewer data points you need to test. The most important thing is trying different things and actually collecting the data. It may seem, based on the PPM graph, that we’ve been fiddling around with bids the past 5 months and none of it mattered for these campaigns. I can assure you, however, that all of these campaigns are more optimized, and that’s because we were diligent in collecting all the data necessary to make better decisions. When something didn’t work, we were able to see that and change it. Nothing genius here. Collect data and optimize to maximize overall profitability, which is the only metric that matters!
Hope you guys found the case study interesting and useful!
Thanks for that case study Tom. I typically bid high to get “better” traffic, but lately pof has sucked roi wise for me. I spent $160 today to make $180 ($20 profit.) I’m going to drop all my bids to try to get better roi and scale out by making different campaigns rather than rely on volume for an individual campaign.
ipyxel is on fire right now thanks for these posts Tom
That’s not a bad idea.